AMM technology or Automated Market Maker is one of the key spheres that makes DeFi an open decentralized financial ecosystem. To make a long story short, AMM brings the possibility to exchange digital crypto assets like DAI for ETH without the need to interact with centralized service providers. Opposite to traditional exchange systems such as Coinbase, Binance, CEX, etc., AMM is just a set of smart-contracts which is based on distributed ledgers like Ethereum. In comparison to centralized counterparties, AMMs do not suffer from censorship, regulations, or pressure on token buyers’ and sellers’ privacy.
AMMs operability is completely user-driven and relies on liquidity mass provided by service users. Each time liquidity providers commit their digital assets, or so-called token pairs, to liquidity pools the system gets “re-fueled’. As a live example, ETH for DAI swap on Uniswap is a direct trade of assets against the liquidity pool.
Table of Contents
Introduction to Automatic Market Makers
Impermanent Loss
Why does Impermanent Loss occur? Example
Mitigating Impermanent Loss. 95/5 and 98/2 pools strategy
Examination of impermanent loss on the example of pools with different assets proportions
Conclusions
What Is Impermanent Loss?
With this brief explanation of AMMs, we can move forward and dive deeper into “impermanent loss”.
Essentially, an impermanent loss can be defined as funds loss during liquidity provision. As an alternative explanation, it can be considered as a difference between funds users hold in AMMs versus funds in the wallet.
Impermanent loss in crypto usually occurs in standard liquidity pools where the liquidity provider obligated to keep both assets in a correct ratio but the price of tokens volatile and diverge in one or another direction where higher difference means greater impermanent loss.
Let’s consider yield farming in the Uniswap DAI/ETH 50/50 liquidity pool as an example. Generally, if one of the tokens goes up or down the pool has to fully rely on uninterrupted arbitrageurs to ensure reflection of the real price of the pair to rebalance the value of both tokens. When this situation occurs, profit from the token is taken away from the liquidity provider. What is more, impermanent loss becomes permanent when liquidity providers decide to withdraw their assets (liquidity). Nonetheless, in rare cases, the loss might be reversed if token prices in the AMM return to their original state.
Looking for a visual explanation of impermanent loss in crypto? Check out this helpful video from our YouTube channel:
Why does Impermanent Loss occur? Example
In order to understand how yield farming impermanent loss occurs, we can review an example of DAI/ETH tokens pair on the Uniswap pool.
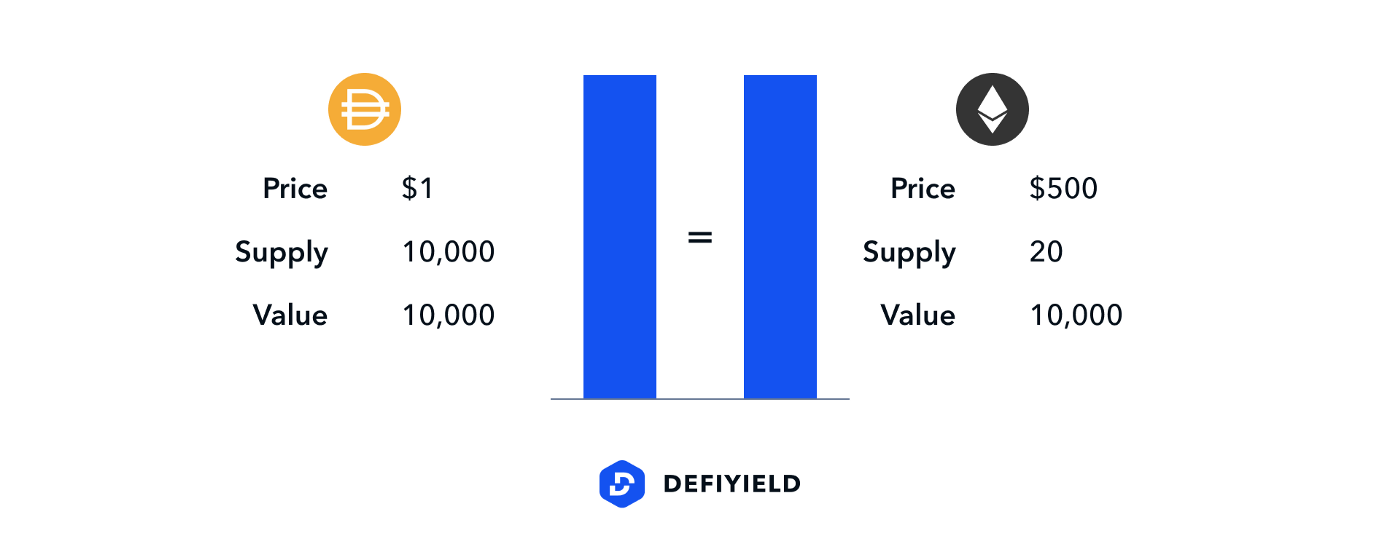
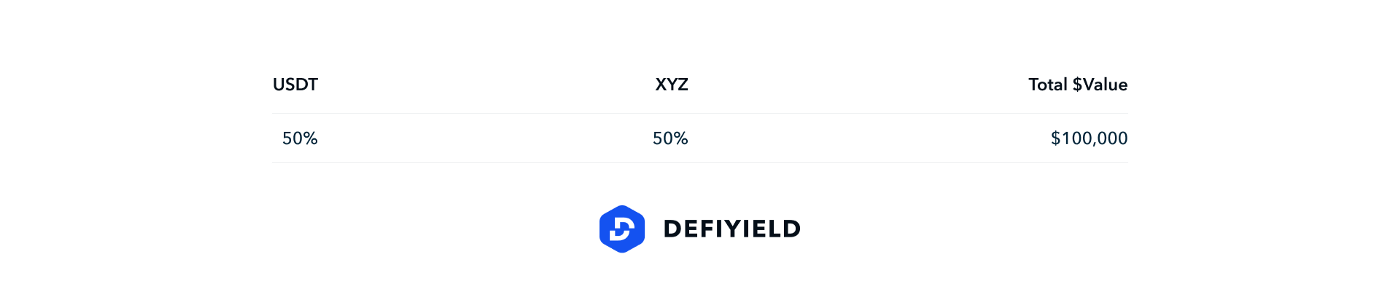
Let’s consider a 50/50 liquidity supply in the pool. Note, to achieve it, liquidity providers have to ensure an equal value for both DAI and ETH.
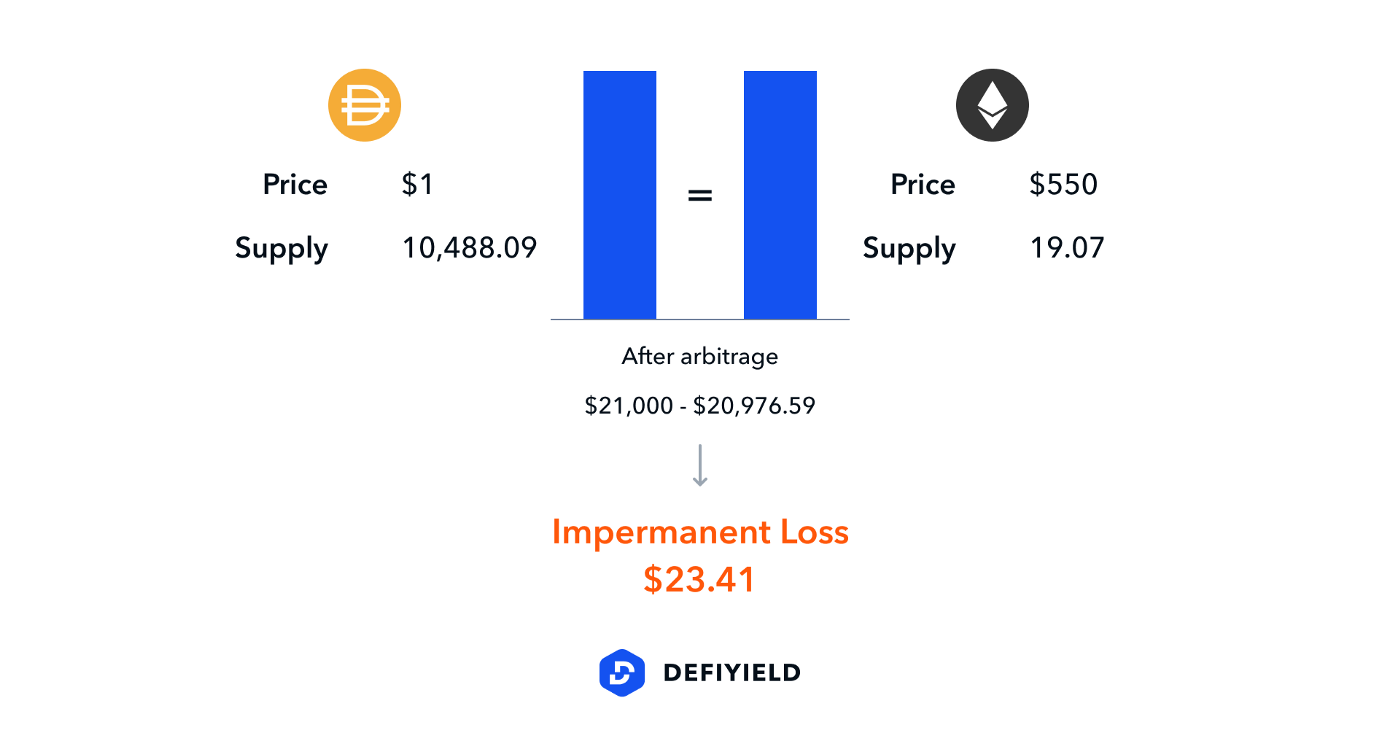
In our case, the price of ETH goes up and raises on Coinbase to $550 for 1 ETH token. This is the exact spot when arbitrageurs get triggered. Differences in crypto prices on Coinbase and Uniswap is a direct opportunity to make a profit for arbitrage. Uniswap utilizes AMM to keep the ratio of tokens balanced in the pool, thus when ETH is constantly bought from the pool, the price of it becomes higher and higher. Obviously, this continues until the price of the ETH stabilizes between the exchanges. So how much ETH arbitrageur has to buy to remove the discrepancy?
Using certain AAM formulas and putting ETH on Coinbase exchange we can determine when ETH price on Uniswap will increase to $550. This will happen once the following supply reached:
10,488.09 DAI
19.07 ETH
The calculation shows us that arbitrageur will buy 0.93 ETH to get Uniswap’s and Coinbase ETH price equal. This will cost 488.09 DAI and result in a price of 524.83 DAI per 1 ETH.
ETH that was bought on Uniswap can be sold for any stablecoin on any other exchange to earn approximately $20–25.
Accordingly, to the example above, crypto liquidity providers would have $23.41 more just for holding their assets in the wallets. As already mentioned, losses could be canceled (become impermanent) if the price of ETH returned back to $500 and no withdrawal made by liquidity providers.
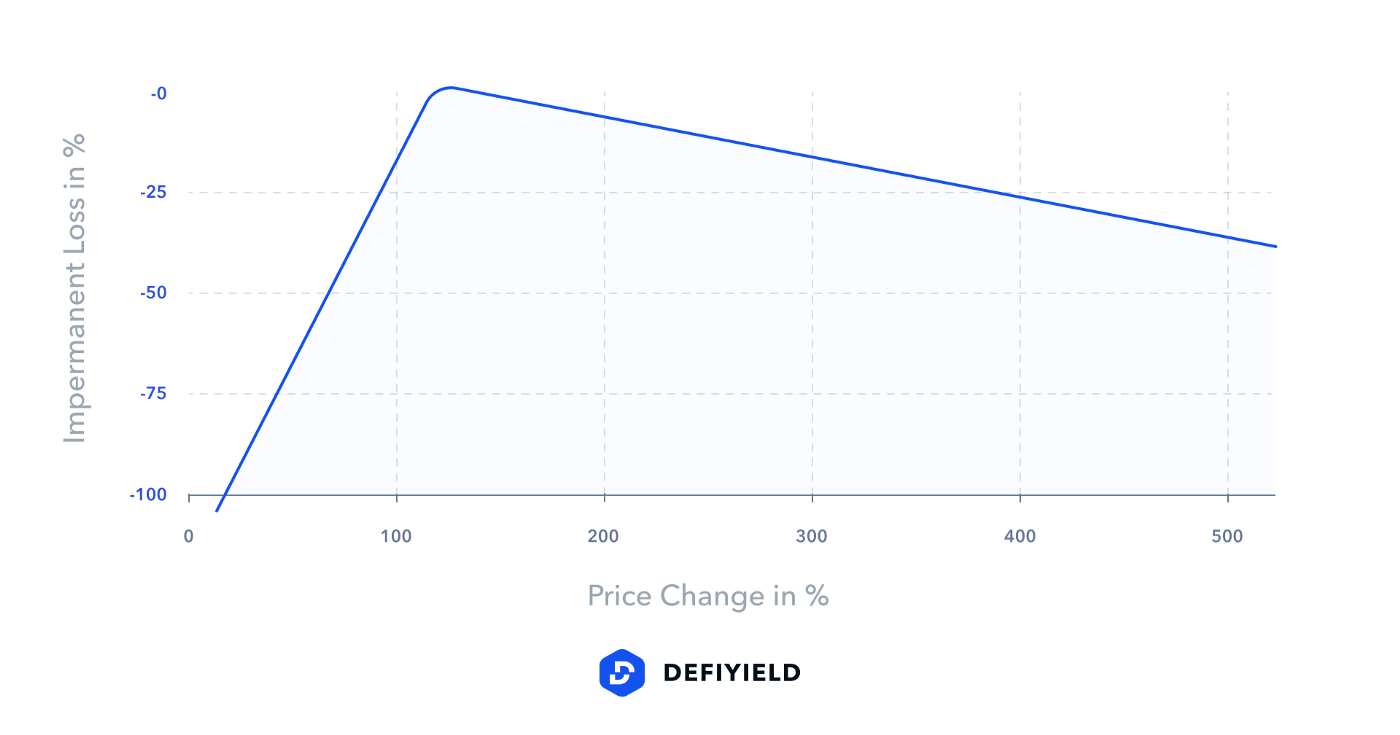
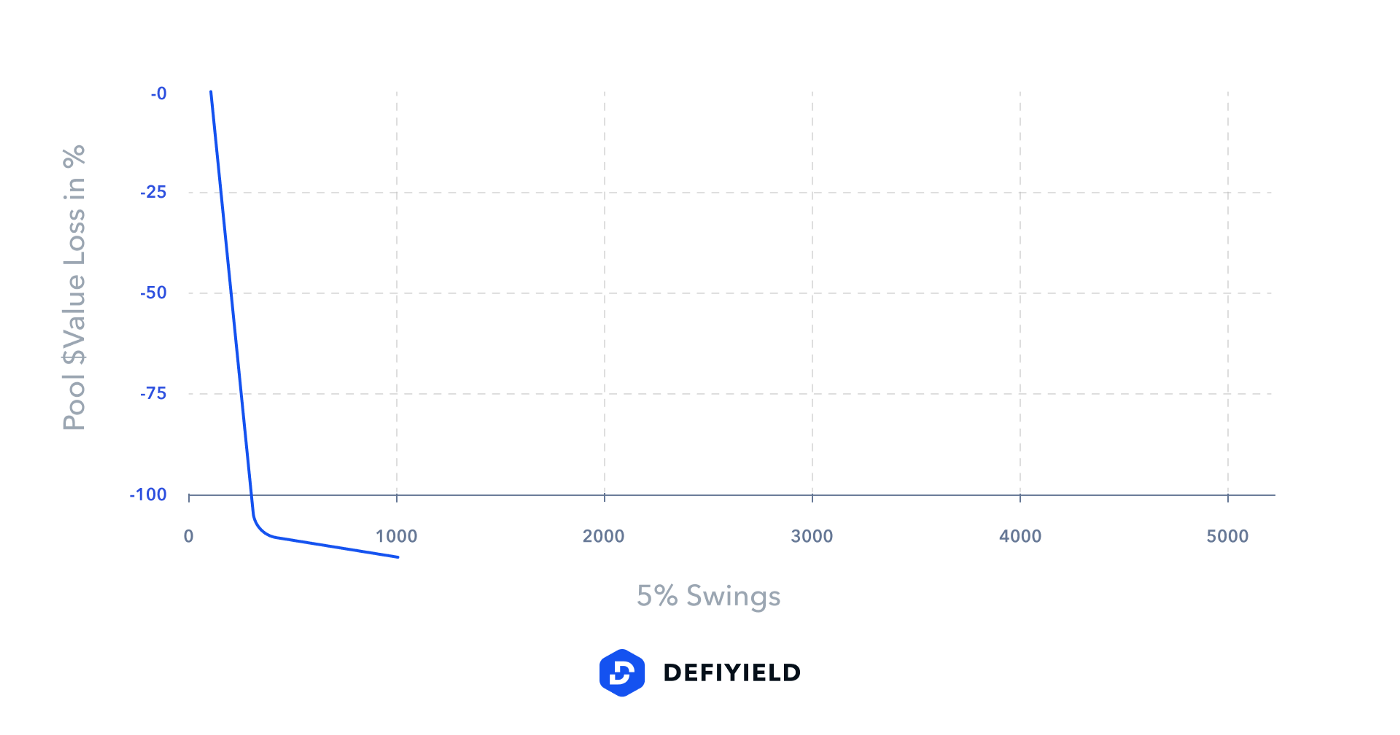
If you examine different price movements, you can see that even small changes in the price of ETH cause liquidity providers to suffer from the impermanent loss. The graph below shows that a 500% price increase against the trading pair can result in a 25% loss of providers’ liquidity reserve:
Mitigating Impermanent Loss. 95/5 and 98/2 pools strategy
The possibility of losing crypto due to impermanent loss started the process of developing strategies to, at least, mitigate it. An important starting point for the in-depth studies was the realization that the risk of impermanent loss can be reduced by minimizing divergence in tokens pair prices. If prices between tokens remain constant for AMM, liquidity providers can trade with less fear of losing their funds. So-called “mirror assets” (sETH/ETH, DAI/USDC, etc. ) — token pairs with a balanced price ratio have proved their resistance against impermanent loss due to notable liquidity and stable profit earnings.
Nonetheless, AMMs that are based on tokens with minimal divergence in price are limited to stablecoins or wrapped into synthetic tokens. Additionally, it is not possible to play a long position without holding extra assets for “backup” when liquidity is provided.
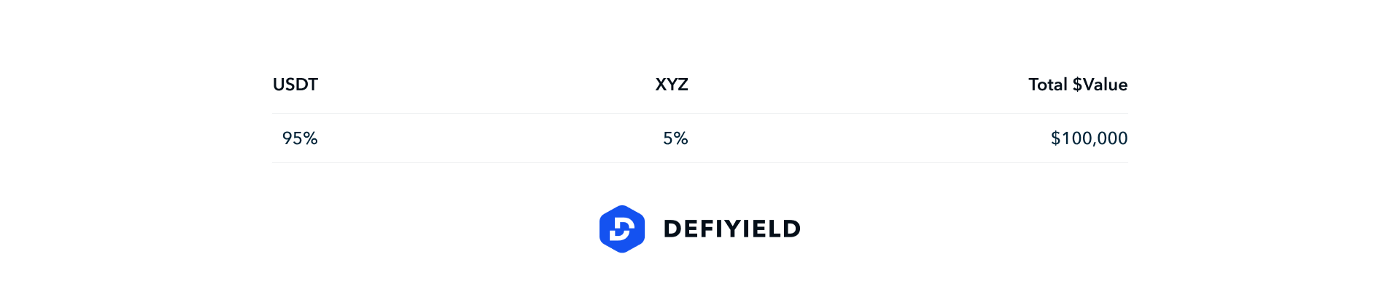
The mirror-assets concept marked the beginning of further investigations on token pairs. The original idea to combine stablecoins and volatile tokens into pairs appeared almost instantly. This leads us to pools that have a proportion which differs from 50:50 in stablecoins but set to 80:20, 95:5, or even 98:2 in stablecoin/volatile token pair.
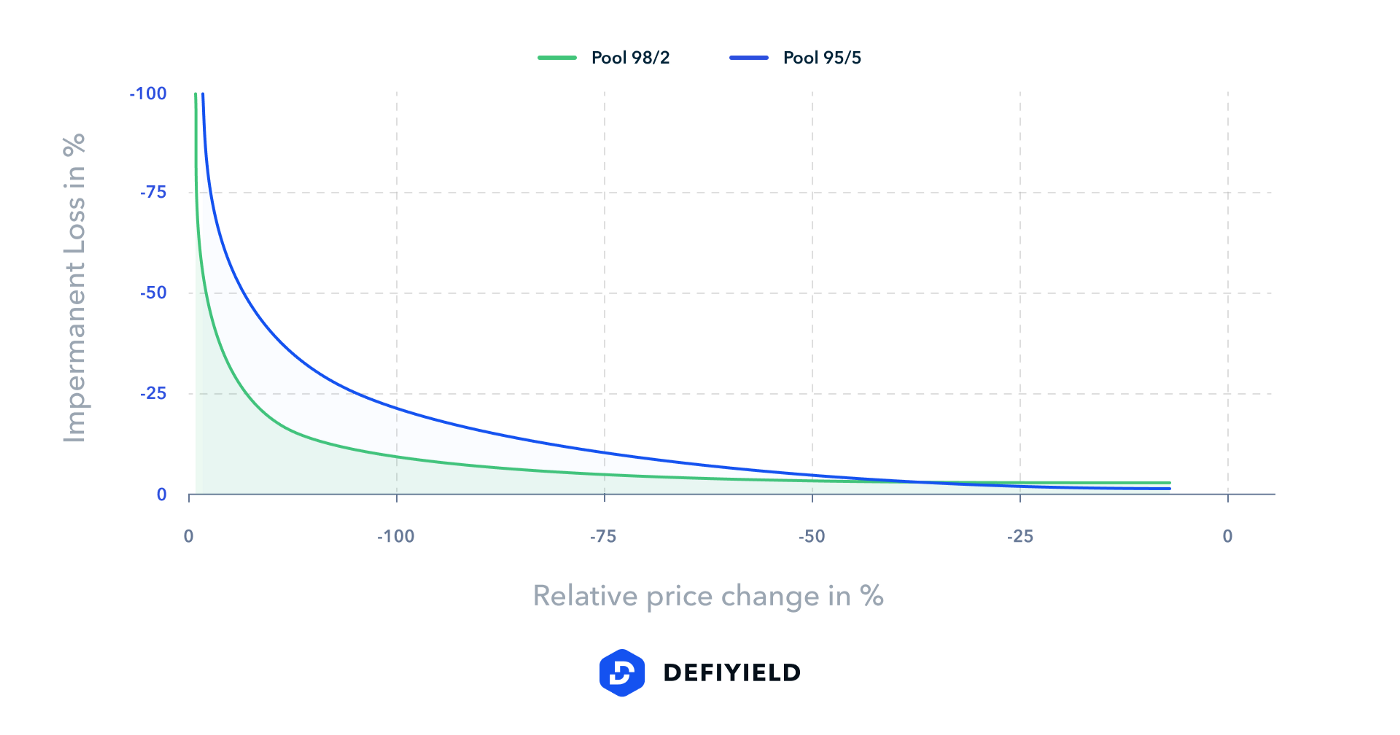
Such pool schemes work for liquidity providers who are interested in keeping a high exposure to a certain asset and wish to mitigate the risk of funds loss when the price of volatile token goes down. But what happens to the impermanent loss when volatile tokens occupy only 2–5% of the entire pool value?
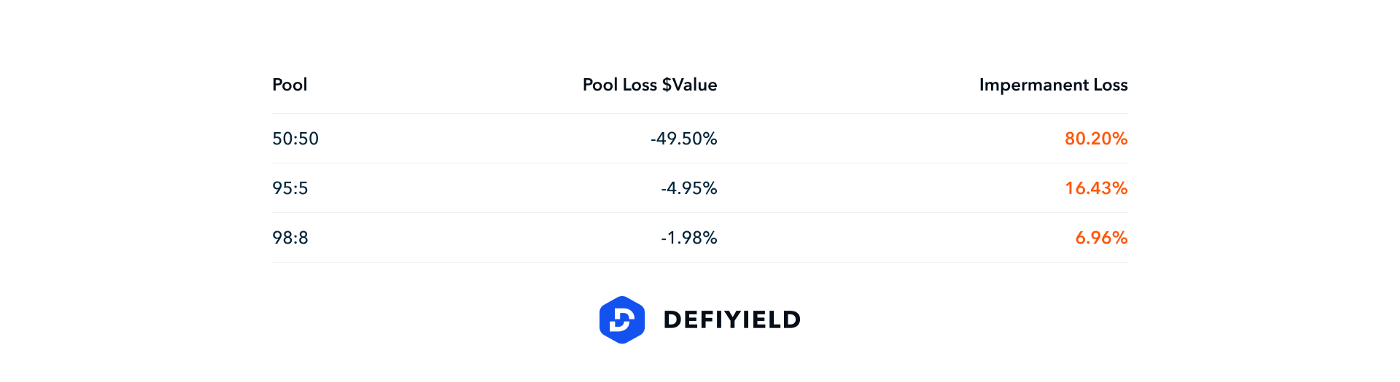
Generally, pools with an unbalanced proportion of assets can reduce the impact of impermanent loss (depending on the weights in the pool). The higher the price of a token, the less the difference of holding the token in the wallet and providing liquidity to the pool. At first glance, the 3% difference in 95:5 and 98:2 should not be noticeable, but don’t judge too quickly. We prepared a comparative review of potential impermanent loss on 50:50, 95:5, and 98:2 pools of USDT/XYZ pair.
⚡* NOTE: You can substitute “XYZ” with any volatile token, such as YFI, YF, sETH, etc.*
In the below case, we will simulate a 50% drop in the XYZ token price. Such a price drop can be perceived as one that rarely occurs but as it turned out it is common when it comes to real-life examples. All of the calculations below are based on exclusive formulas and the concept of death spirals. By utilizing these we’ve tried to illustrate the iterative nature of token price drops and reproduce possible scenarios of pool corrections per balancer tact.
Examination of impermanent loss on the example of pools with different assets proportions
Before we move on to the comparison, let’s define the concept of death spirals.
The death spiral is a phenomenon of value loss that occurs when a pool repeatedly eliminates its resources. The concept refers to situations in which the pool falls into a spiral of constant value drops until its complete depreciation. Spirals of death tailored to show literally the worst possible scenario when pool degradation goes in a progressive manner and rollback to the initial state are likely, not possible. To make it simpler, the spiral of death can be considered as a combination of factors which play against pool condition repeatedly. Constant price drops, liquidity withdraws, decreasing level of trust triggers the absolute devaluation of the pool value.
A particularly striking example of a death spiral can be observed on the so-called “Rug Pulls” — are when the creator of the farming pool hides up the back door that allows printing an infinite amount of tokens. Typically, such a backdoor is well designed and disguised in extremely complex smart contracts. Since yield contracts are very difficult to read and the pool creator promised that the token supply is limited, users invest without much fear. As soon as the pool gains the necessary weight, the pool owner triggers a special function that boosts the price just before the tokens unload on the market. This is the exact behavior of “Rug Pull” — a move that destroys trust, transparency, and finally, the price of the token.
In our case, we will not focus on the specific causes of the losses, but rather consider how the degradation progresses on different pool types and which of those are less susceptible to losses. Plus, we will cover the percentage of impermanent loss per each pool to reveal a dependency between assets proportion and cost damage progression.
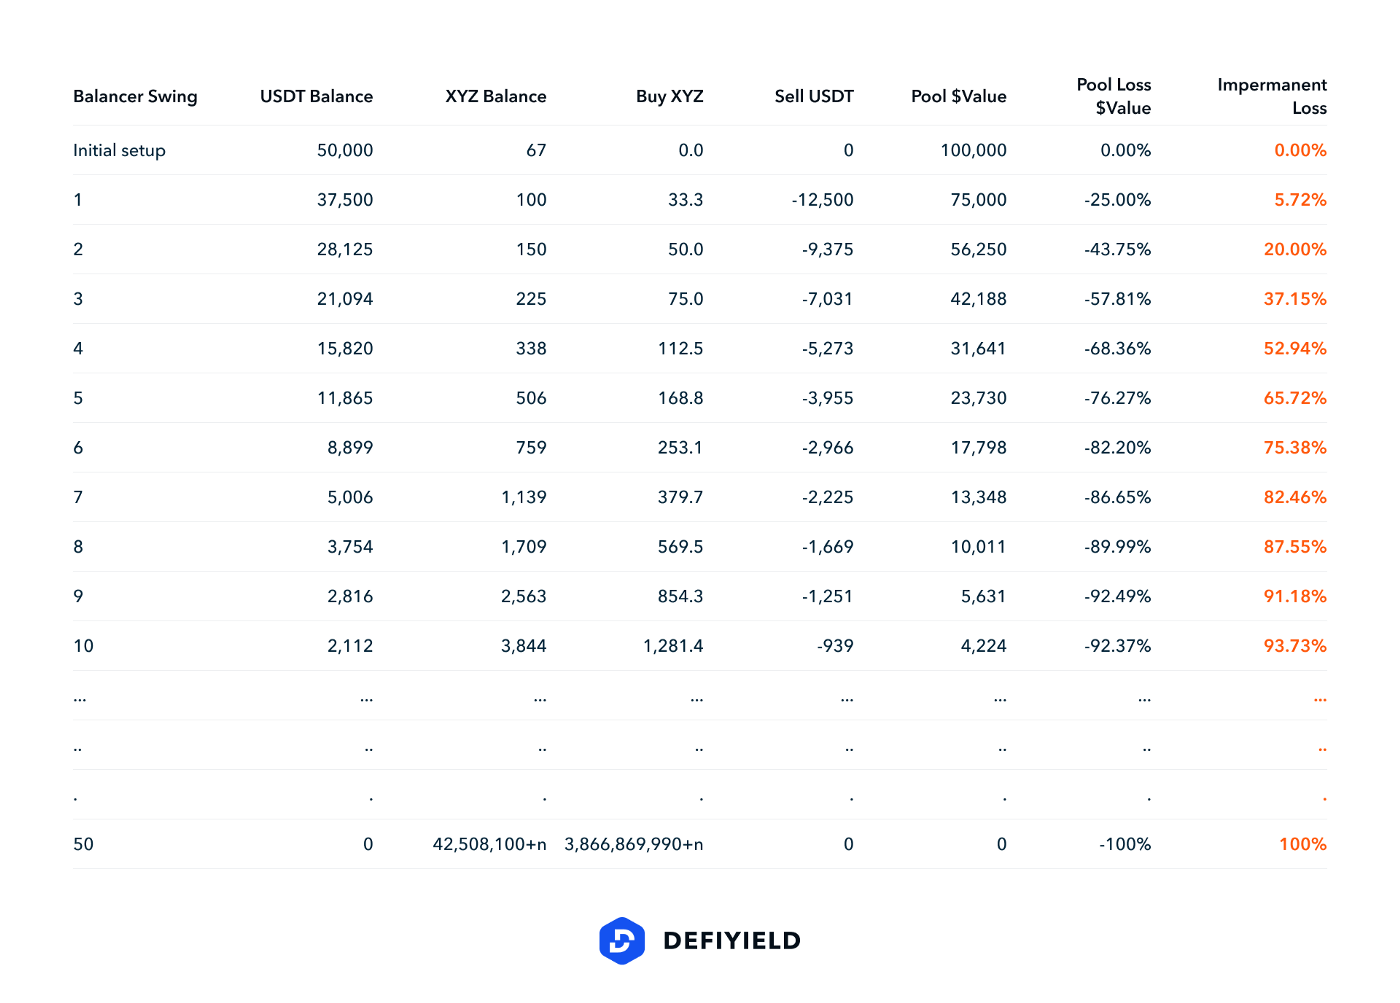
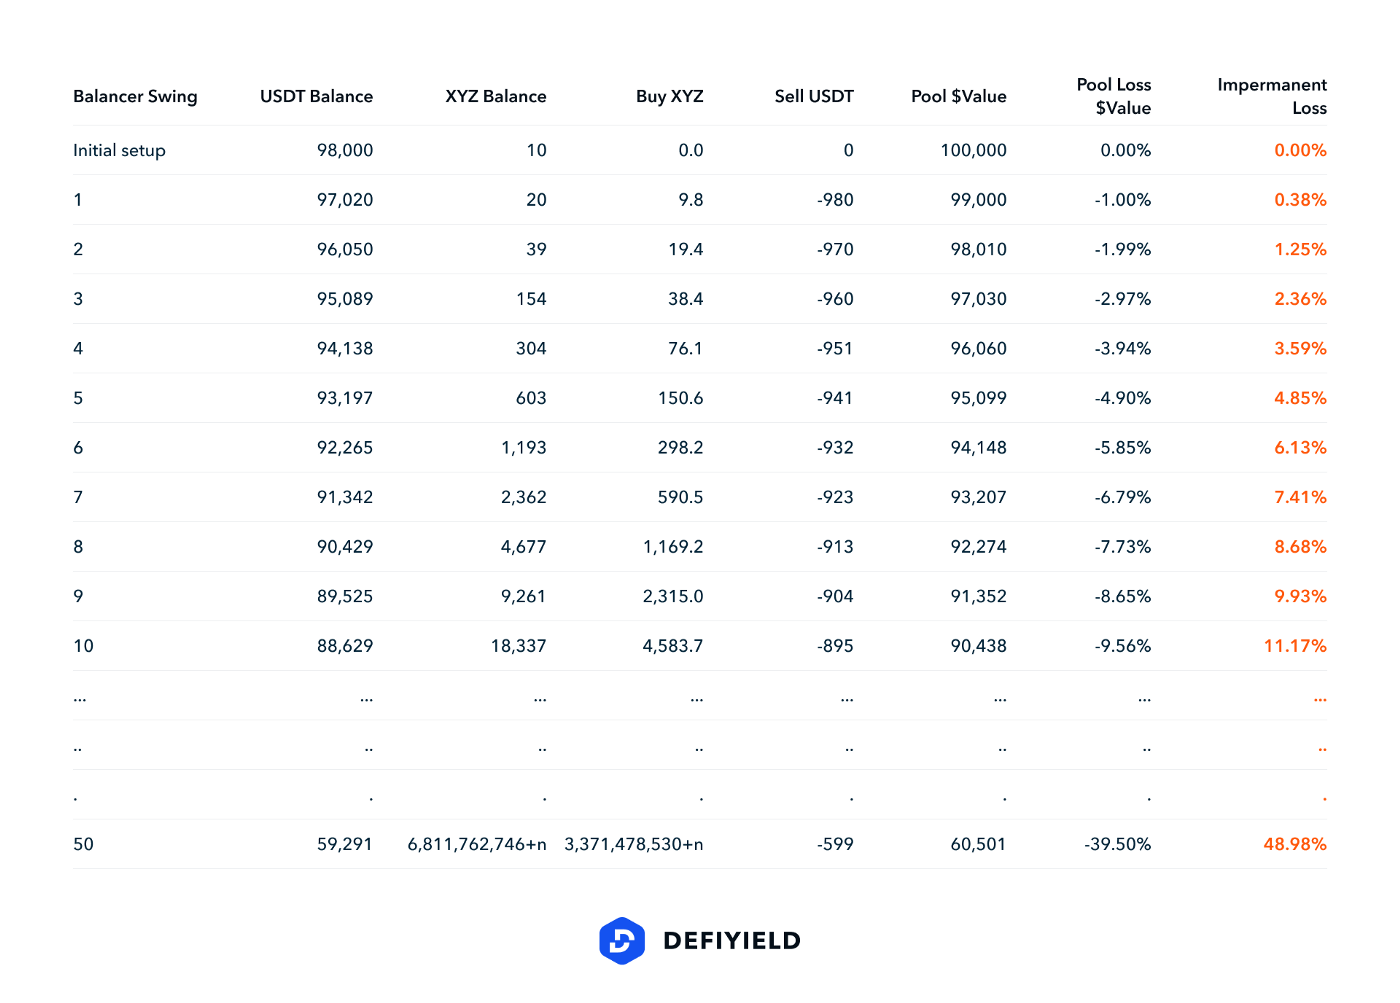
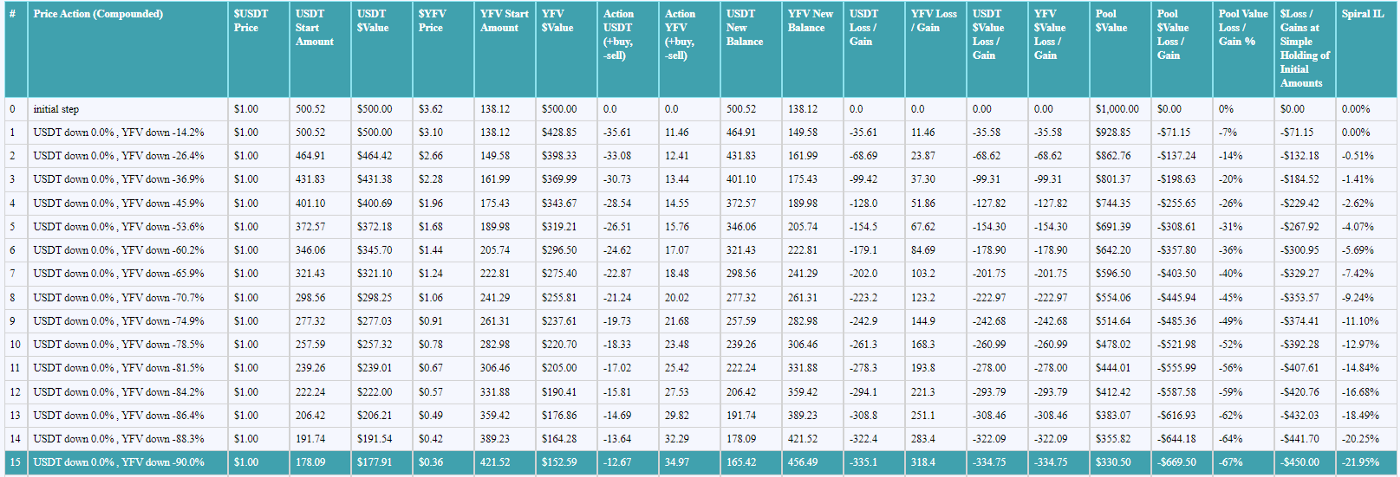
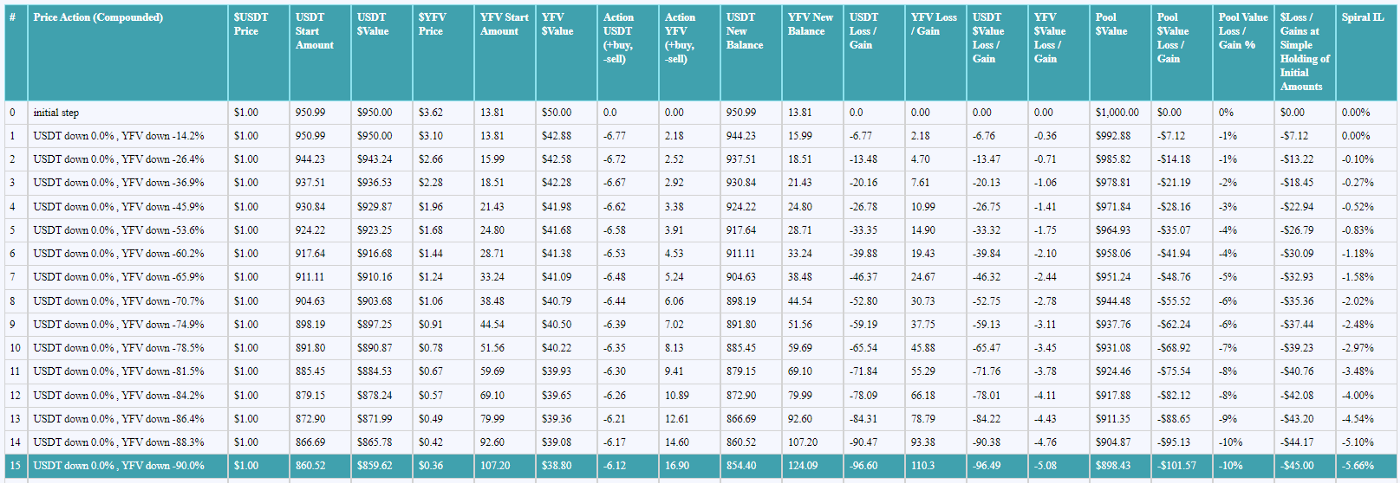
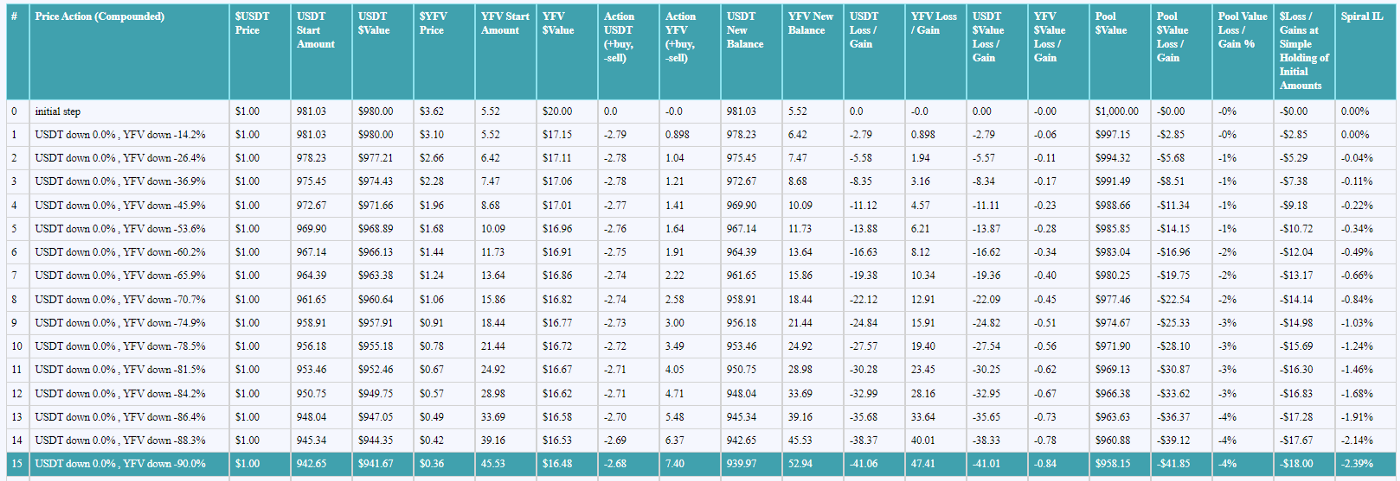
Below you will see three tables based on the concept of death spirals. The first row of the table corresponds to the initial state of the pool when the last one shows what would happen to the pool resources and what percentage of impairment loss we would have by a 50th drop in the price of the token.
Columns definition:
Balancer swing — an iteration during which the balancer equalizes the value of assets in the pool by selling/buying one of the tokens from the pair. It is worth mentioning, that time duration between swings may vary, and therefore, price corrections may occur irregularly.
USDT Balance — the amount of USDT assets per one balancer swing
XYZ Balance — the amount of XYZ assets per one balancer swing
Buy XYZ — the amount of XYZ tokens that need to be purchased to equalize the value of assets in the pool
Sell USDT — the amount of USDT tokens that need to be sold to equalize the value of assets in the pool
Pool $Value -the total amount of assets in the pool
Pool Loss $Values — percentage by which a pool is worth less in comparison to the initial Pool $Value.
Impermanent loss — the percentage by which a pool is worth less than it would have if liquidity providers had just held their tokens outside of the pool
⚡* NOTE: Pay attention to these examples (Pool #1, Pool #2, Pool# 3 ), if you are wondering about real-life 95:5 pools.*
#3 Pool 98/2 example
⚡ *NOTE: Another example of a real pool with a 98:2 proportion that are worth visiting : DUST:LINK pool*
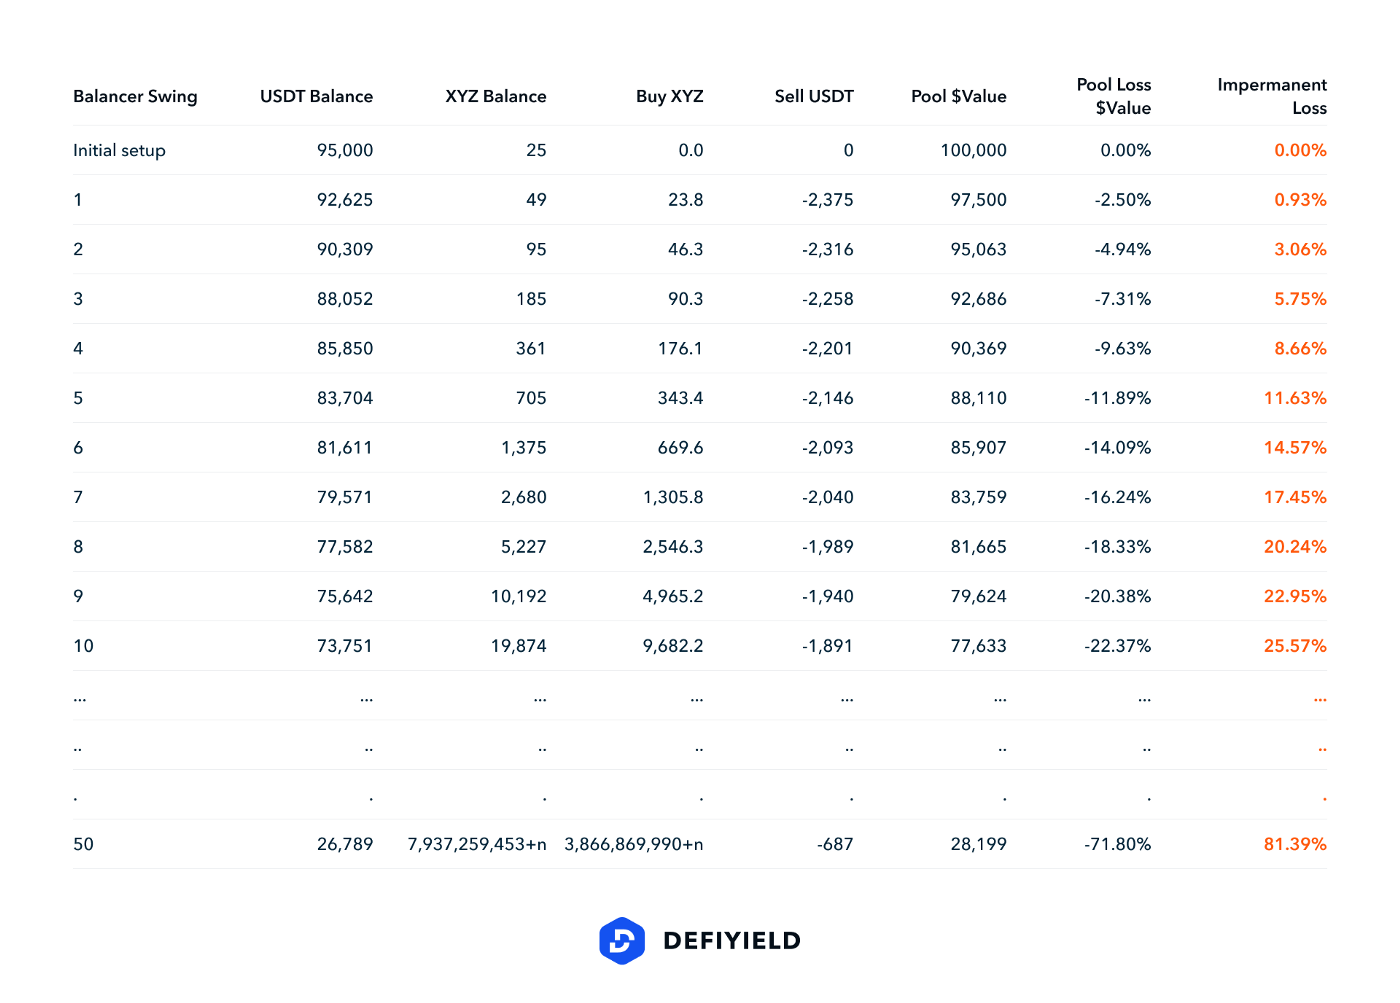
Pay close attention to the impermanent loss values in row #10. It shows us that just in 10 balancer swings impermanent loss will be as follows:
Pool #1 50:50–93.73%
Pool #2 95:5–25.57%
Pool #3 98:8–11.17%
As you can see, losses on pool 95:5 (25.57%) are twice as large as on 98:2 (11.17%), moreover, it is getting worse with each balancer attempt to stabilize assets in the pool. Nonetheless, these two are still in good condition in comparison to 50:50 where losses got to 93.73% that literally means liquidity providers just lost almost everything they invested.
In practice, tokens will likely drop in price gradually (e.i. $100>$75>$50>$25…N) thus it is hard to predict the exact percentage of losses.
However, it is still possible when XYZ token price drops almost instantly, like from $100 to $1(-99% in value). If this is the only one and final drop, the balancer will stabilize the price between tokens by selling the required amount of USDC and buying XYZ. Such a scenario will end up in fairly low losses of pool value and percentage of impermanent loss.
Sadly, but in real life, it won’t stop just in one correction cycle. This particular case is the one that is simulated by most of the currently known impermanent loss calculators. That’s the exact point where the bone of contention lies. Basically, this method of calculation is limited and does not take into account further balancer corrections, future price drops, and liquidity withdraws which in turn leads to completely wrong numbers of impermanent loss percentage.
On the other hand, in our example, we have made a calculation of multiple drops with the step of 50% on the volatile token price each time the balancer performs swing. This approach is not a panacea as well, since XYZ token price fluctuations between swings may vary. With this being said, we did an advance forecast to see potential losses, not only at a certain point in time but rather to observe the progression of loss growth.
Are 98:2 pools the ultimate solution to the problem of impermanent loss?
No, they are certainly not, but they are definitely worth considering. Despite the fact that 98:2 pools in comparison to 95:5 are much less risky, there is still a possibility that even 1–4% of daily yield might be “eaten” by 5–15% of the impermanent loss. Small exposure, only 2% of the entire pool value, won’t guarantee the lack of losses completely, therefore it is always better to investigate before investing and calculate impermanent loss impact upfront.
How can I correctly calculate the possible Impermanent Loss?
In order to calculate an impermanent loss, you can use the following formulas:
Where:
PC1 — priceChange1 in asset #1
PC2 — priceChange2 in asset #1
W1 — the weight of asset #1
W2 — the weight of asset #2
The above formulas should only be used to calculate impermanent loss at a certain point in time and do not show a possible percentage of final losses.
There are a lot of tools for impermanent loss estimation but most of the known utilities are wrong in their calculations or pretty limited in terms of functionality. Therefore, in order to rectify this, the de.fi.info team decided to come up with its own impermanent loss calculator accessible by following the direct link: https://de.fi/
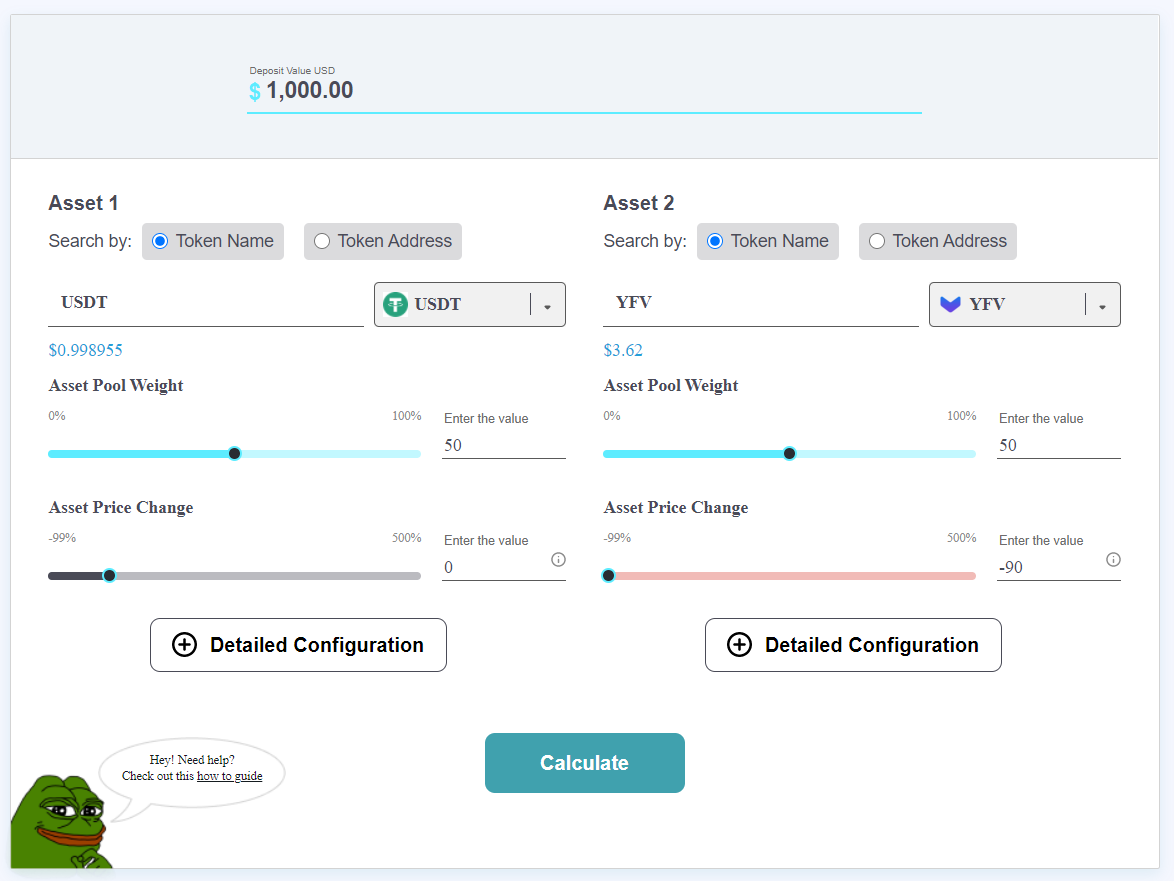
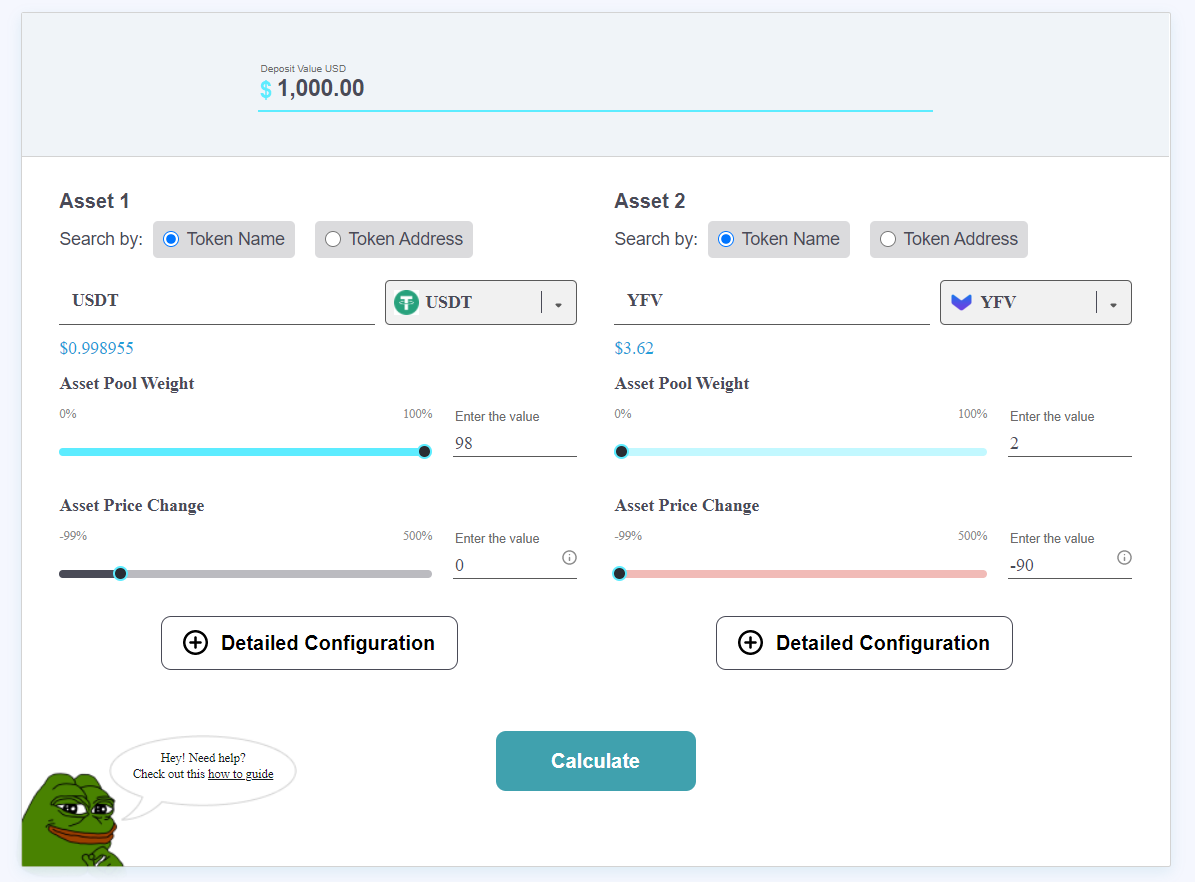
The calculator is free to use so anyone interested is welcome to play around with values and decide whether it’s worth enrolling in a particular lending opportunity or not. To get started, just fill in the required fields and press the “Calculate” button.
Deposit Value USD — the amount of the deposit in USD that you invest in the pool.
Asset 1/2 — asset name. Can be determined by either token name or token address
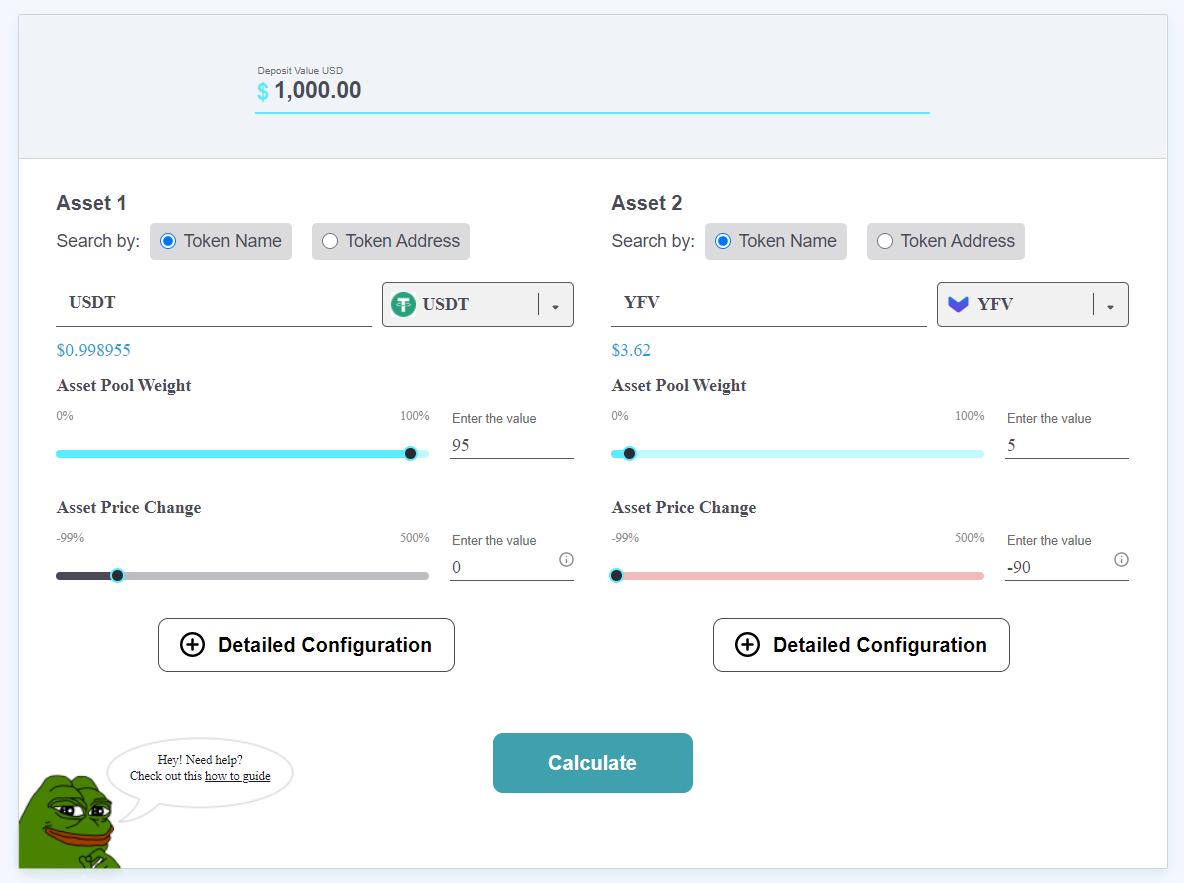
Asset Pool Weight — a percentage share of assets in the pool. Used to set token pair ratio (pool type) for example, 80:20, 95:5, 98:2, etc.
Asset Price Change — total asset price change in percentage, e.g. +50% or -90%
Detailed Configuration (optional setting) here you can configure the so-called Curve Slope as long as the market price swings can be drastic (e.g. a -50% price collapse), or gradually reaching the target price (e.g. consecutive 2–5% drops to reach the 50% of the starting price) by selecting one of the following options:
Sharp slope corresponds to a swift price increase/decrease
Normal slope corresponds to a medium price increase/decrease
Mild slope corresponds to the gradual price increase/decrease
Below you will find an example of calculations for 50:50, 95:5, and 98:2 pools with a pair consisting of a stable coin — USDT and a volatile token — YFV. Since USDT is stable, we suppose that its Asset Price Change is 0. On the other hand, the Asset Price Change of YFV is set to -90%.
Pool 50:50
Pool 95:5
Pool 98:2
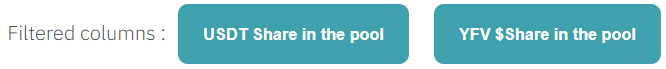
⚡ NOTE: *de.fi impermanent loss calculator allows you to filter assets shared in the pool. To do so, simply click on the appropriate button next to the filtered columns section.*
Conclusions
Impermanent loss is a direct threat to the popularization of AMM principles and decentralized markets of passive income for anyone with idle assets. However, recently discovered strategies of risk-minimization turn automatic market makers into an efficient solution for maintaining liquidity decentralization.
Impermanent loss risk mitigation has a direct impact on the yield framing industry, “mirror assets” pairs, and volatile-token exposures on pools with 95:5, 98:2 proportions are one of the best options offered so far.
3% of the difference between 95:5 and 98:2 pools transforms into 2x losses when it comes to a significant price drop in token pairs.
The market is full of utilities for calculating potential impermanent losses, but most of them are useless for real-life calculations. In this regard, the de.fi.info team has developed a unique free-to-use IL calculator — https://de.fi/
When engaging with decentralized finance (DeFi), investors often face the challenge of managing investments, tracking yields, and ensuring they keep all their assets safe.
With new crypto ecosystems popping up on a regular basis, the integration of different blockchain networks with popular wallets is a key narrative moving into the next crypto cycle.
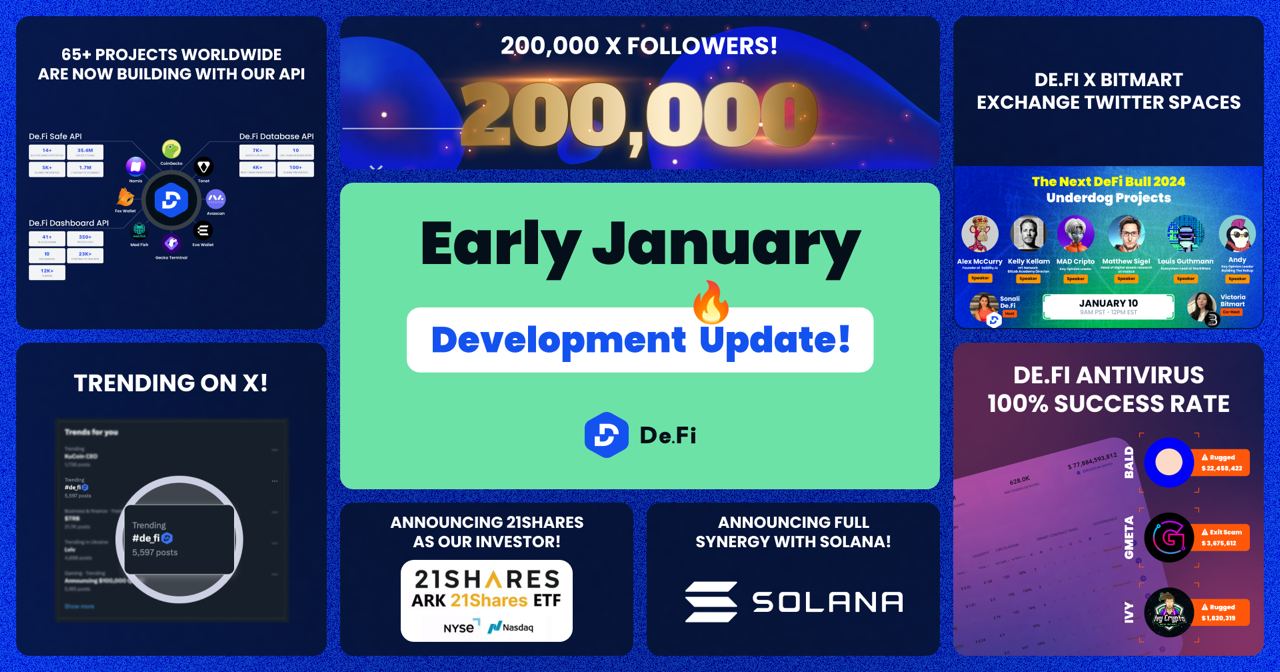
This month, we are proud to announce that De.Fi has secured investments from the first BTC ETF provider. We're seeing a huge spike in mentions and social interest in De.Fi and $DEFI token right before the listing.